Asset Requirements Validation
Summary Dashboard
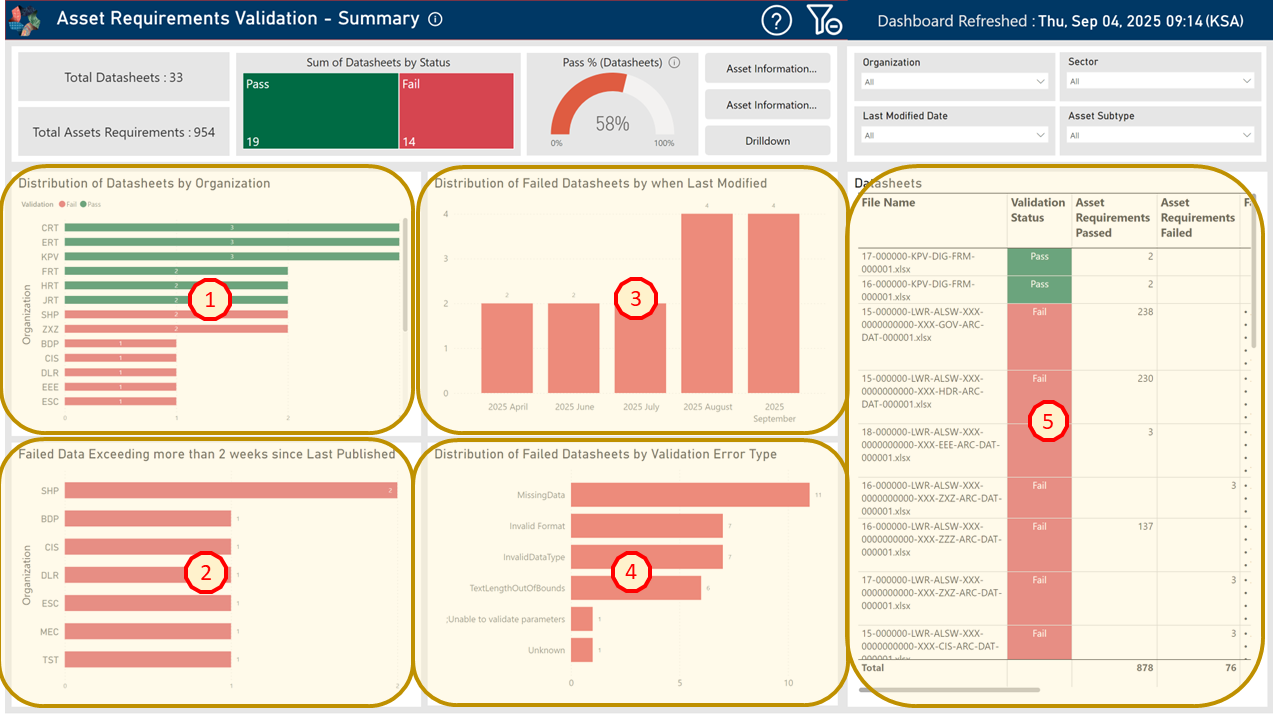
Fig. 1 - Asset Requirements Validation - Summary Dashboard Key Areas
1. Distribution of Datasheets by Organization
- Displays a bar chart of total Pass or Failed datasheets across different Organizations (Design Consultant). If the scroll bar is visible, use this to view the rest of organizations.
- Use the ‘Validation’ legend to dynamically filter the bar chart and isolate by ‘Fail’ (Red) or ‘Pass’ (Green).
- Click a bar for any specific organization in the bar chart to dynamically update the whole dashboard with its specific Passed (Green) or Failed (Red) datasheets and associated metrics.
- To reset the dashboard, click the Clear Filters icon in the Title Bar.
2. Failed Data Exceeding more than 2 weeks since Last Modified
- Displays a bar chart of failed datasheets by organization (Design Consultant) that have not been updated in the last 2 weeks.
- Click a bar for any specific organization in the bar chart to dynamically filter the whole dashboard by its Failed (Red) datasheets and associated metrics.
- To reset the dashboard, click the Clear Filters icon in the Title Bar.
3. Distribution of Failed Datasheets by when Last Modified
- Displays a bar chart of failed datasheets by when last modified date.
- Click a bar for the specific month in the bar chart to dynamically filter the whole dashboard by its Failed (Red) datasheets and related metrics.
- To reset the dashboard, click the Clear Filters icon in the Title Bar.
4. Distribution of Failed Datasheets by Validation Error Type
- Displays a bar chart of failed datasheets by validation error type.
- Click a bar for a specific error type in the bar chart to dynamically filter the whole dashboard by its Failed (red) error type and related metrics.
- To reset the dashboard, click the Clear Filters icon in the Title Bar.
5. Datasheets
- Displays a table helping users to quickly understand datasheet validation details.
- Each row in the table shows the following columns as shown below.
- File name – The specific datasheet that has been analyzed through AII’s Validation Process.
- Validation status – The status of the datasheet in question represented either as Pass (Green) or Fail (Red).
- Number of Asset Requirements Passed – Representative of the amount of Asset Requirements that have passed in each datasheet. Please note, the overall datasheet can still fail, if one or more Asset Requirement(s) have failed. Thus, this provides the user with the amount of Passed & Failed.
- Number of Asset Requirements Failed – Representative of the amount of Asset Requirements that have failed in each datasheet. As mentioned on the earlier point, if one or more Asset Requirements have failed, the entire datasheet is ‘Failed’.
- Failure reason(s) - If the datasheet failed, reason(s) for failure are provide- For example, Value provided is not from the defined PICKLIST.
- Datasheet Link – A link is provided to the specific datasheet submission in ACC.
- Last Modified Date - The last date when the datasheet has been modified by the Design Consultant.
- Click the arrow in any column header to sort the table by that column’s values, either in ascending or descending order.
- Click one or more rows to dynamically filter the dashboard by the selected datasheets and view their related metrics. Hold Ctrl to select multiple rows.
- To reset the dashboard, click the Clear Filters icon in the Title Bar.
Drilldown Dashboard
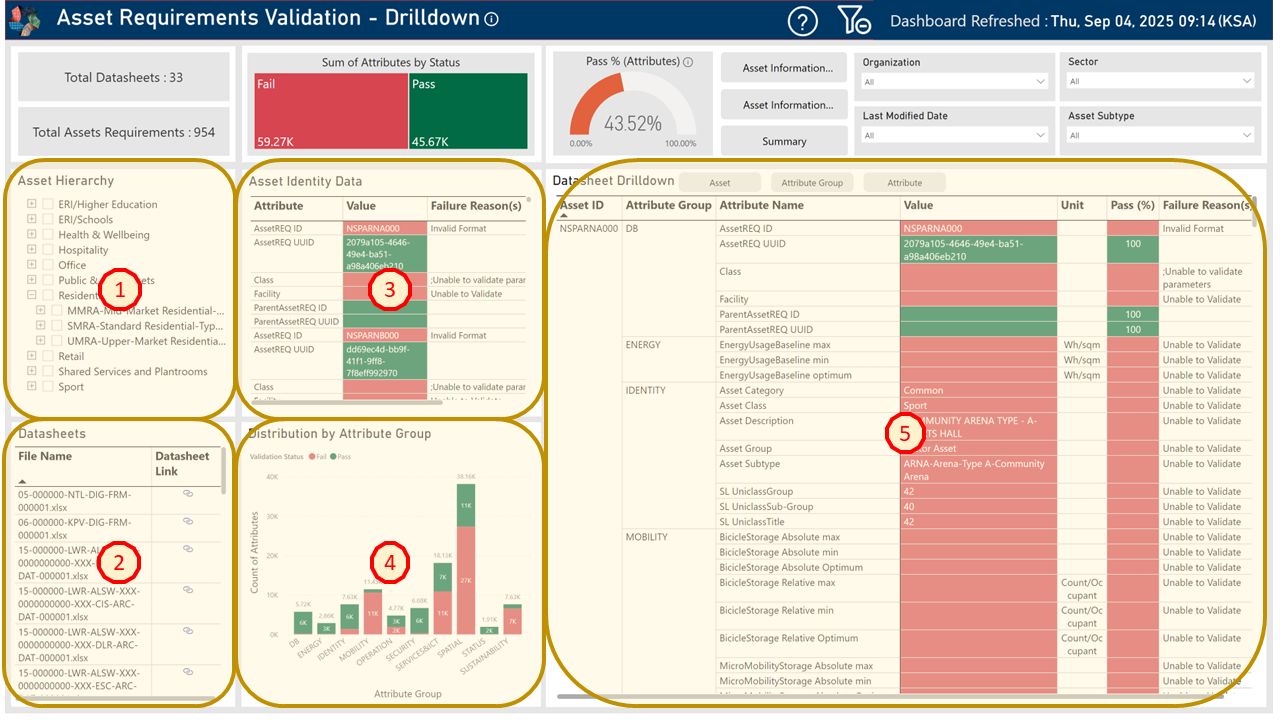
Fig. 2 - Asset Requirements Validation - Drilldown Dashboard Key Areas
1. Asset Hierarchy
- The table displays the Asset Hierarchy from all datasheets based on the NEOM Sectors such as Residential, Retail, Health & Wellbeing etc.
- Each Asset Hierarchy can be expanded or collapsed to view its linked child items. For example, Residential > MMRA – Mid-Market Residential Type A > MidMarket 1B – Type B > NTLMMRB001.
- Select one or more Asset Hierarchies (and linked child items) to dynamically filter the whole dashboard and view related metrics. (Hold down Ctrl key for multiple selections).
- To reset the dashboard, click the Clear Filters icon in the Title Bar.
2. Datasheets
- Displays a list of all datasheets analyzed by the AII Validation Process. If the scroll bar is visible, use this to view the rest of the datasheets.
- Each row shows the datasheet’s file name and includes a link. Clicking the link, opens the datasheet in a new browser tab via ACC.
- Click the arrow in any column header to sort the table by that column’s values, either in ascending or descending order.
- Click one or more rows to dynamically filter the whole dashboard by the selected datasheets and view their related metrics. Hold Ctrl to select multiple rows.
- To reset the dashboard, click the Clear Filters icon in the Title Bar.
3. Asset Identity Data
- The table displays key details for each asset attribute representing its uniqueness and its relationship to a Parent Asset (if applicable), helping you quickly assess their status.
- Each row in the table shows: Attribute Unique ID, the current value of the attribute highlighted as either Passed (Green) or Failed (Red), The failure reason(s), if failed and its associated Asset ID.
- Click the arrow in any column header to sort the table by that column’s values, either in ascending or descending order
- Select one or more rows (hold Ctrl to select multiple) to dynamically filter the whole dashboard by those attributes and view related metrics.
- To reset the dashboard, click the Clear Filters icon in the Title Bar.
4. Distribution by Attribute Group
- Displays a bar chart that shows the number of Attributes that have Passed (Green) or Failed (Red) across Attribute Groups. Attribute Groups contain collections of attributes representative of a type of information collecte- For example, Energy, Mobility, Security, Services & ICT, etc.
- Use the ‘Validation Status’ key to update the bar chart and view all ‘Fail’ (Red) or ‘Pass’ (Green) attributes by attribute group.
- Select one or more attribute groups (hold Ctrl to select multiple) to dynamically filter the whole dashboard by those attributes groups and view related metrics.
- To reset the dashboard, click the Clear Filters icon in the Title Bar.
5. Datasheet Drilldown
- Displays a table that shows the detailed attributes that have Passed (Green) or Failed (Red) captured against an asset (Asset ID) helping users to quickly understand attribute validation details.
- Each row in the Datasheet Drilldown presents the following below.
- Asset ID – An Unique ID assigned to every Asset that contains a specific geometry and that can be placed at a location as a component. For example, ‘NSPARNB000’.
- *_Attribute Group – A collection of attributes assigned to the Asset, which refer to a specific piece of information or characteristic that describes it. For example, the attribute group titled ‘Operations’ are all attributes related to operations and maintenance aspect of the given asset.
- Attribute Name – An attribute name is the label or title that identifies a specific information or characteristic of the asset. For example, ‘OperationalStaff’ describes the number of operational staff is required to service the given asset.
- Value – The attribute value is the actual data, information or measurement captured against the specific attribute name.
- Unit – The unit of measurement for the given attribute value tells you what kind of quantity the value represents and how it is measure- For example ‘Sq.M’ (square meter).
- Pass % – When an attribute and its value has undertaken AII’s validation process, the Pass % is shown in green with a value of 100%. When a value for a corresponding attribute fails validation, they are highlighted in red to indicate an issue.
- Failure Reason(s) – When a value for a corresponding attribute fails validation, the failure reason(s) are shown to explain exactly why it failed.
- Click the arrow in any column header to sort the table by that column’s values, either in ascending or descending order
- Select one or more rows (hold Ctrl to select multiple) to dynamically filter the whole dashboard across different categories and view the related metrics.
- To reset the dashboard, click the Clear Filters icon in the Title Bar.
- Use the filter buttons: Asset, Attribute Group, or Attribute at the top of the table - to narrow down the table based on your selection. To remove all filters and show the full table again, click the Clear Filters icon in the Title Bar.