Space Information Compliance
Summary Dashboard
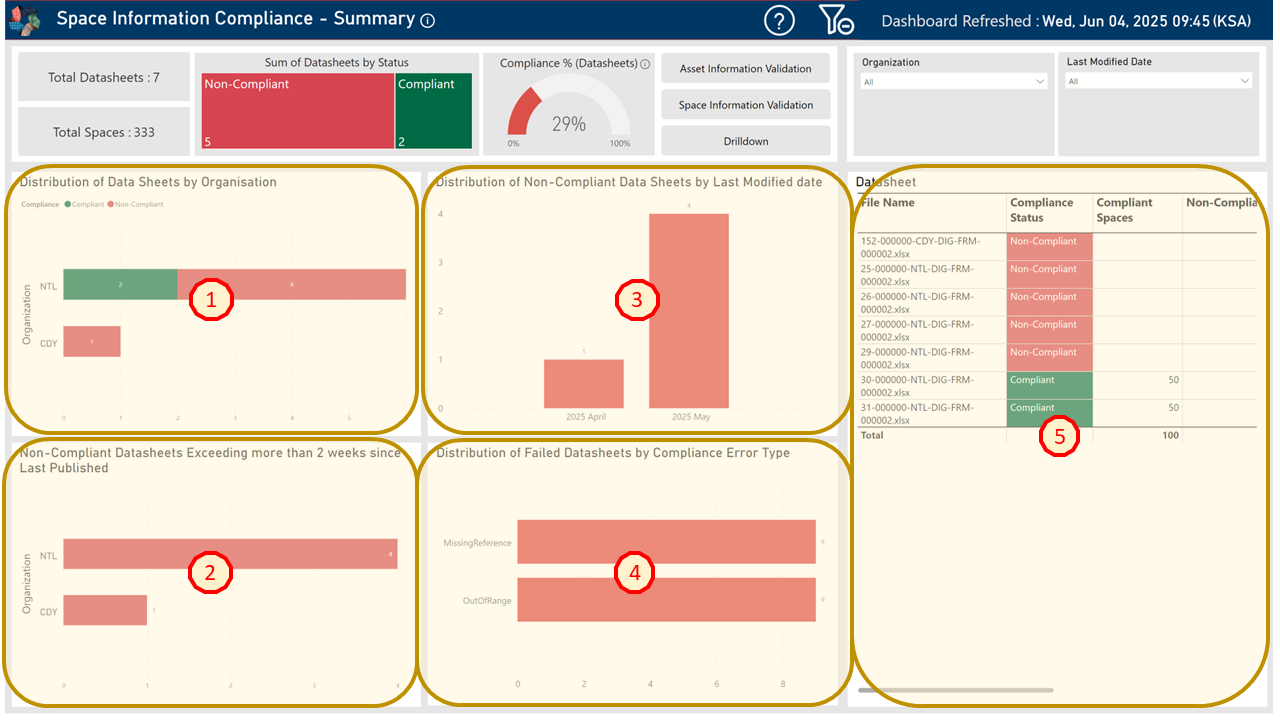
Fig. 1 - Space Information Compliance - Summary Dashboard Key Areas
1. Distribution of Datasheets by Organization
- Displays a bar chart of total Compliant or Non-Compliant across different Organizations (Design Consultant). If the scroll bar is visible, use this to view the rest of organizations.
- Use the ‘Compliance Status’ legend to dynamically filter the bar chart and isolate by ‘Non-Compliant’ (Red) or ‘Compliant’ (Green).
- Click a bar for any specific organization in the bar chart to dynamically update the whole dashboard with its specific Compliant (Green) or Non-Compliant (Red) datasheets and associated metrics.
- To reset the dashboard, click the Clear Filters icon in the Title Bar.
2. Non-Compliant Datasheets Exceeding more than 2 weeks since Last Published
- Displays a bar chart of Non-Compliant by organization (Design Consultant) that have not been updated in the last 2 weeks.
- Click a bar for any specific organization in the bar chart to dynamically filter the whole dashboard by its Non-Compliant (Red) datasheets and associated metrics.
- To reset the dashboard, click the Clear Filters icon in the Title Bar.
3. Distribution of Non-Compliant Datasheets by when Last Modified
- Displays a bar chart of Non-Compliant datasheets by when last modified date.
- Click a bar for the specific month in the bar chart to dynamically filter the whole dashboard by its Non-Compliant (Red) datasheets and related metrics.
- To reset the dashboard, click the Clear Filters icon in the Title Bar.
4. Distribution of Non-Compliant Datasheets by Compliance Error Type
- Displays a bar chart of Non-Compliant datasheets by error type.
- Click a bar for a specific error type in the bar chart to dynamically filter the whole dashboard by its Non-Compliant (Red) error type and related metrics.
- To reset the dashboard, click the Clear Filters icon in the Title Bar.
5. Datasheets
- Displays a table helping users to quickly understand datasheet compliance details.
- Each row in the table shows the following columns as shown below.
- File name – The specific datasheet that has been analyzed through AII’s Compliance Process.
- Compliance status – The status of the datasheet in question represented either as Compliant (Green) or Non-Compliant (Red).
- Compliant Spaces – Representative of the amount of Spaces that have achieved compliance in each datasheet. Please note, the overall datasheet can still fail, if one or more Spaces are Non-Compliant. Thus, this provides the user with the amount of Compliant & Non-Compliant counts.
- Non-Compliant Spaces – Representative of the amount of Spaces that are Non-Compliant in each datasheet. As mentioned on the earlier point, if one or more Spaces are found Non-Compliant, the entire datasheet is tagged as 'Non-Compliant’.
- Non-Compliant reason(s) - If the datasheet is Non-Compliant, reason(s) for non-compliance are provided. For example, 'OutofRange'.
- Datasheet Link – A link is provided to the specific datasheet submission in ACC.
- Last Modified Date - The last date when the datasheet has been modified by the Design Consultant.
- Click the arrow in any column header to sort the table by that column’s values, either in ascending or descending order.
- Click one or more rows to dynamically filter the dashboard by the selected datasheets and view their related metrics. Hold Ctrl to select multiple rows.
- To reset the dashboard, click the Clear Filters icon in the Title Bar.
Drilldown Dashboard
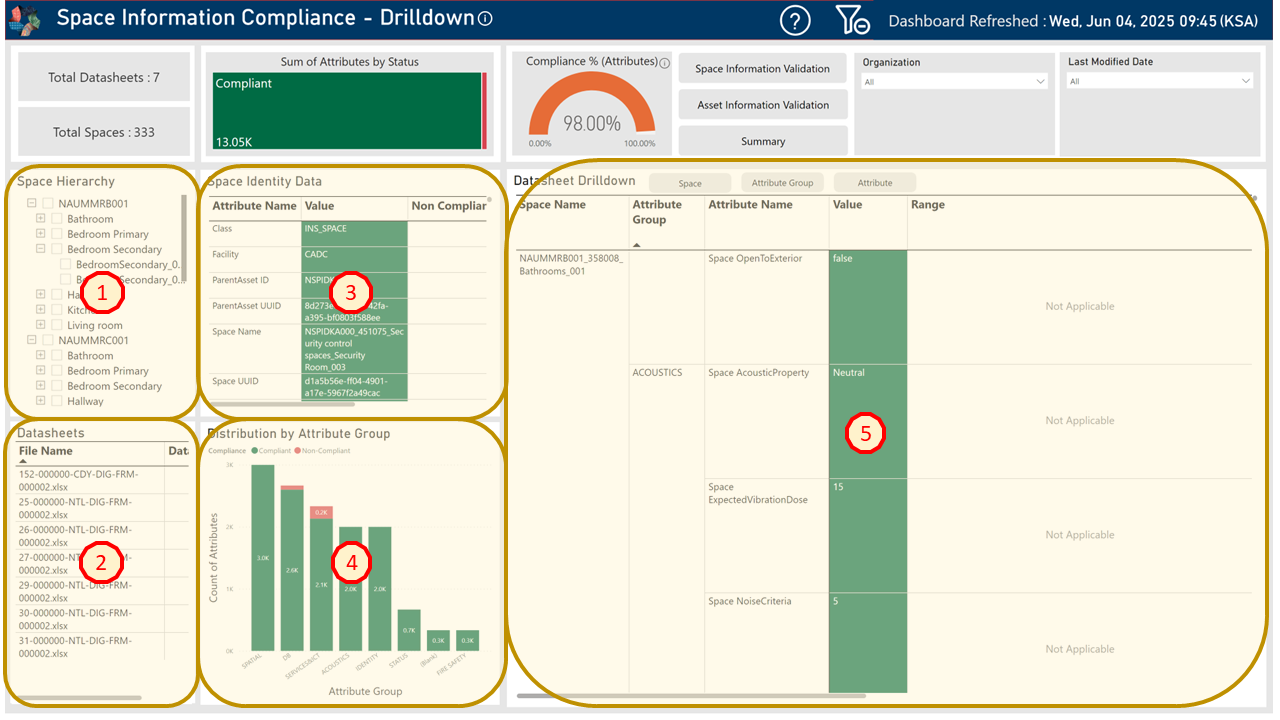
Fig. 2 - Space Information Compliance - Drilldown Dashboard Key Areas
1. Space Hierarchy
- The table displays the Space Hierarchy from all space datasheets based on the subdivision of Spaces, such as Classrooms, Hallways, Bedrooms etc.
- Each Space Hierarchy can be expanded or collapsed to view its linked child items. For example, TSCAQ00000 > Specialist Reading Area.
- Select one or more Space Hierarchies (and linked child items) to dynamically filter the whole dashboard and view related metrics. (Hold down Ctrl key for multiple selections).
- To reset the dashboard, click the Clear Filters icon in the Title Bar.
2. Datasheets
- Displays a list of all datasheets analyzed by the AII Compliance Process. If the scroll bar is visible, use this to view the rest of the datasheets.
- Each row shows the datasheet’s file name and includes a link. Clicking the link, opens the datasheet in a new browser tab via ACC.
- Click the arrow in any column header to sort the table by that column’s values, either in ascending or descending order.
- Click one or more rows to dynamically filter the whole dashboard by the selected datasheets and view their related metrics. Hold Ctrl to select multiple rows.
- To reset the dashboard, click the Clear Filters icon in the Title Bar.
3. Space Identity Data
- The table displays key details for each Space attribute representing its uniqueness and its relationship to a Parent Asset (if applicable), helping you quickly assess their status.
- Each row in the table shows:
- Attribute Name - Description of the attribute required.
- Value - Current value populated by the Design Consultant. Additionally, the value is highlighted as either 'Compliant' (Green) or 'Non-Compliant' (Red).
- Non-Compliance Reason(s) - If Non-Compliant, Information is displayed with Non-Compliant reason(s) such as 'DuplicateEntry', etc.
- Click the arrow in any column header to sort the table by that column’s values, either in ascending or descending order
- Select one or more rows (hold Ctrl to select multiple) to dynamically filter the whole dashboard by those attributes and view related metrics.
- To reset the dashboard, click the Clear Filters icon in the Title Bar.
4. Distribution by Attribute Group
- Displays a bar chart that shows the number of Attributes that have Compliant (Green) or Non-Compliant (Red) across Attribute Groups. Attribute Groups contain collections of attributes representative of a type of information collected. For example, Energy, Mobility, Security, Services & ICT, etc.
- Use the ‘Compliance’ key to update the bar chart and view all ‘Fail’ (Red) or ‘Pass’ (Green) attributes by attribute group.
- Select one or more attribute groups (hold Ctrl to select multiple) to dynamically filter the whole dashboard by those attributes groups and view related metrics.
- To reset the dashboard, click the Clear Filters icon in the Title Bar.
5. Datasheet Drilldown
- Displays a table that shows the detailed attributes that have Passed (Green) or Failed (Red) captured against an Space (Space ID) helping users to quickly understand attribute validation details.
- Each row in the Datasheet Drilldown presents the following below.
- Space Name – An Unique Name assigned to every Space that contains a specific geometry and that can be placed at a location as a component. For example, ‘AHCA000001_000000_Reception areas_Reception_513’.
- *_Attribute Group – A collection of attributes assigned to the Space, which refer to a specific piece of information or characteristic that describes it.
- Attribute Name – An attribute name is the label or title that identifies a specific information or characteristic of the Space.
- Value – The attribute value is the actual data, information or measurement captured against the specific attribute name, represented either as Compliant (Green) or Non-Compliant (Red).
- Range - When applicable, a visual is presented as a Candle Wick graph. This represents the value provided by the Design Consultant against the defined thresholds set by its corresponding Space Requirement. The thresholds presented are explained further below.
- Yellow - Actual is between Minimum & Optimum (Min < Actual < Optimum).
- Orange - Actual is between Minimum & Optimum (Min < Actual < Optimum).
- Green - Actual is between Minimum & Optimum (Min < Actual < Optimum).
- Red - Actual is between Minimum & Optimum (Min < Actual < Optimum).
- Threshold markers are also colour-coded and presented on the range:
- a. Minimum - Brown
- b. Optimum - Blue
- c. Maximum - Grey
- d. Actual - Black
- Pass % – When an attribute and its value have undertaken AII’s Compliance process, the Pass % is shown in green with a value of 100%. When the value for a corresponding attribute is Non-Complaint, they are highlighted in red to indicate an issue.
- Non Compliance Reason(s) – When a value for a corresponding attribute fails Compliance, the failure reason(s) are shown to explain exactly why it failed.
- Click the arrow in any column header to sort the table by that column’s values, either in ascending or descending order
- Select one or more rows (hold Ctrl to select multiple) to dynamically filter the whole dashboard across different categories and view the related metrics.
- To reset the dashboard, click the Clear Filters icon in the Title Bar.
- Use the filter buttons: Space, Attribute Group, or Attribute at the top of the table - to narrow down the table based on your selection. To remove all filters and show the full table again, click the Clear Filters icon in the Title Bar.