How to use the dashboards effectively
Filtering and drilling down into the data.
Summary Dashboards
Summary dashboard pages provide high-level insights into how organizations (Design Consultants) are performing across all their datasheet submissions. Package BIM Leads and Design Managers can interact with the following filters to tailor specific insights.
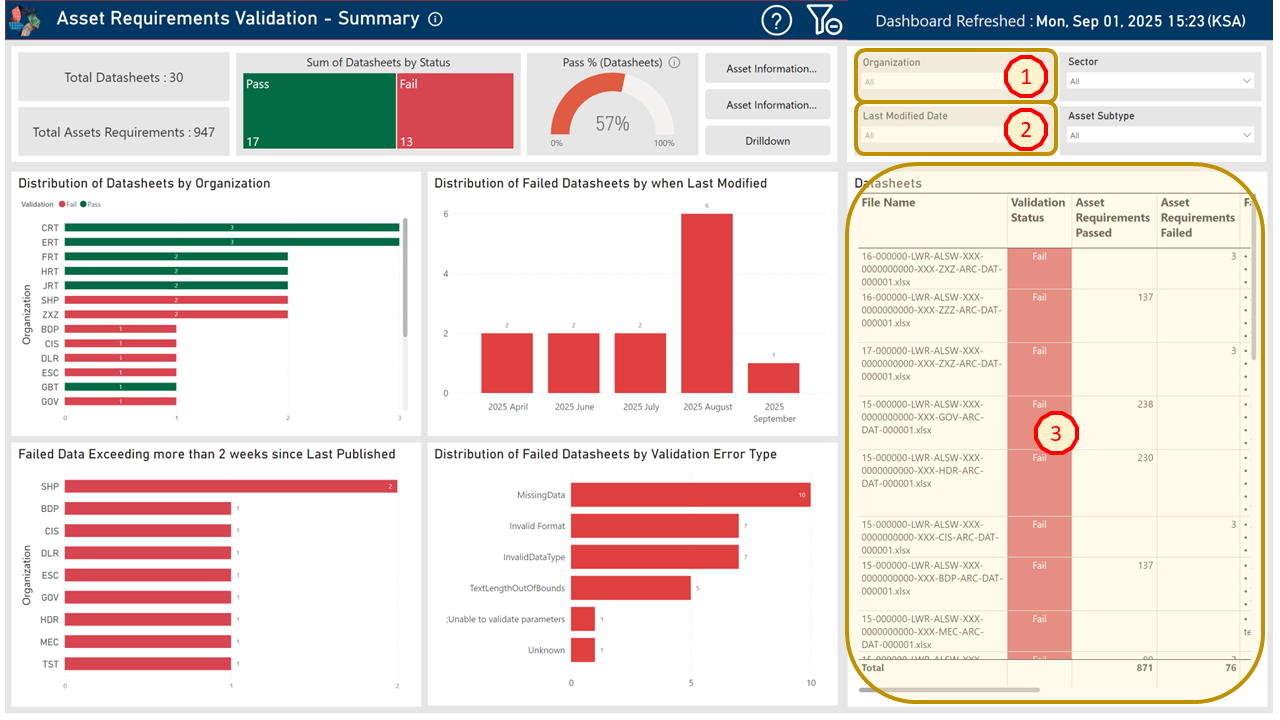
Fig.1 - Summary Dashboard Best Practice
- Organization Filter
- Select a specific organization (Design Consultant) to view their performance, as all charts and visuals on the page will update accordingly.
- The Pass % metric along with charts such as Distribution of Non-Compliant Data Sheets by Last Modified Date and Distribution of Failed Datasheets by Compliance Error Type.
- Last Modified Date Filter
- Use this filter to narrow down data by specific dates or years, based on specific or ranges of submissions required.
- This is particularly useful for tracking progress of Design Consultant(s) over time or reviewing their recent submissions / updates.
- Datasheet Table
- Displays all data relevant to the selected filters on the dashboard page. This table provides a comprehensive view of datasheets that meet the filter criteria.
Important Note (Expand to see)
Using Slicers / Filters in PowerBI is essential to isolate specific results.
For example, filtering by organization and date support Package BIM Leads and Design Managers to quickly indentify datasheets, that requires attention based on performance metrics.
Drilldown Dashboards
Drill-down dashboards pages allow for an in-depth and granular anaylsis of datasheets to be performed. This includes all filters from the Summary dashboards, along with two additional filters, as the following below.
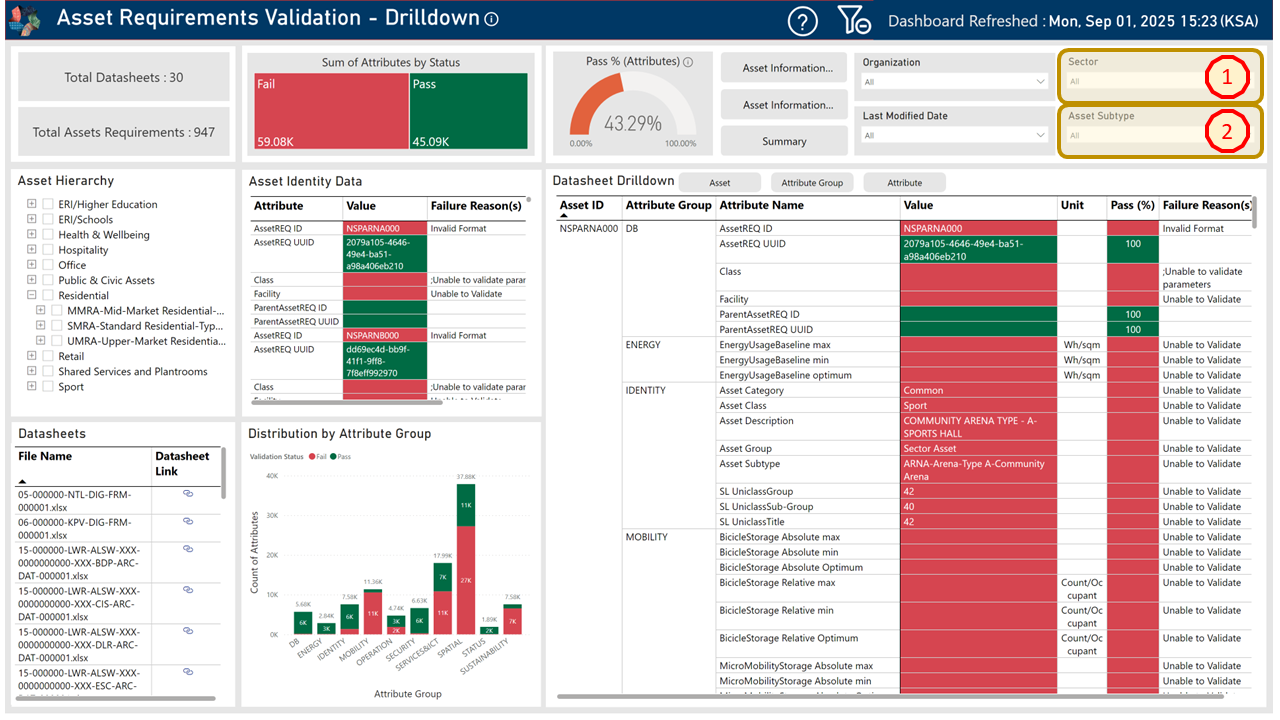
Fig.2 - Drilldown Dashboard Best Practice
- Sector Filter
- Applicable only to asset datasheets and it allows users to view data by sector.
- Subtype Filter
- Also specific to asset datasheets. This filter enables further isolation by asset sub-type.
These filters support users analyze datasheets by organization, sector, and subtype. therefore, to drill-down into specific issues.
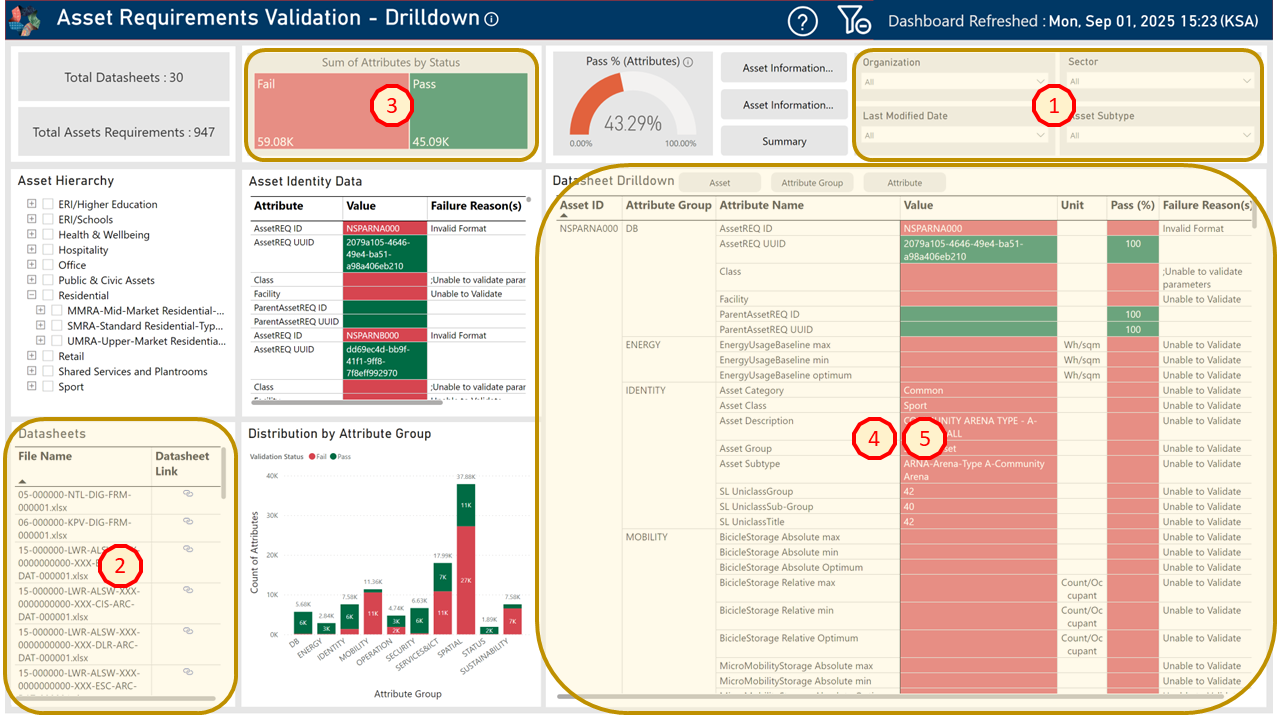
Fig.3 - Drilldown Dashboard Deeper Analysis
- Apply filters by starting with Organization and then by either Sector or Subtype on the Slicer / Filters section of the dashboard.
- Select the datasheet of interest.
- Hold Ctrl and click on the Validation or Compliance status card of the High-Level Metric panel as shown in Figure 3.
- The table as shown in Figure 3 will update to show all failed attributes for the selected datasheet.
- This table can be exported and shared with the Design Consultant responsible to acknowledge and address accordingly.
Important Note (Expand to see)
Users can apply different combination of filters based on their specifc needs.
The combination are not limited to the examples mentioned above, allowing for a flexible and tailored slicing of the dashboards.
This table can be exported for further review or reporting purposes, as shown on "Exporting Reports and Visuals" below.
Exporting reports and visuals.
Fig.4 - Export Report from Dashboard
- Click the ellipsis (⋯) in the top-right corner of any visual to access export options.
- Select Export data to download the underlying data in Excel or CSV format.