Validation Dashboard - Package BIM Lead
The Validation Dashboards provide Package BIM Leads with a comprehensive overview of Datasheet Quality through KPIs and Metrics. These are presented in both Summary and Drill-Down views to support high-level and detailed information to be reviewed by the idenitfied users.
Switch between the tabs below to get a brief look at Validation Dashboard layouts!
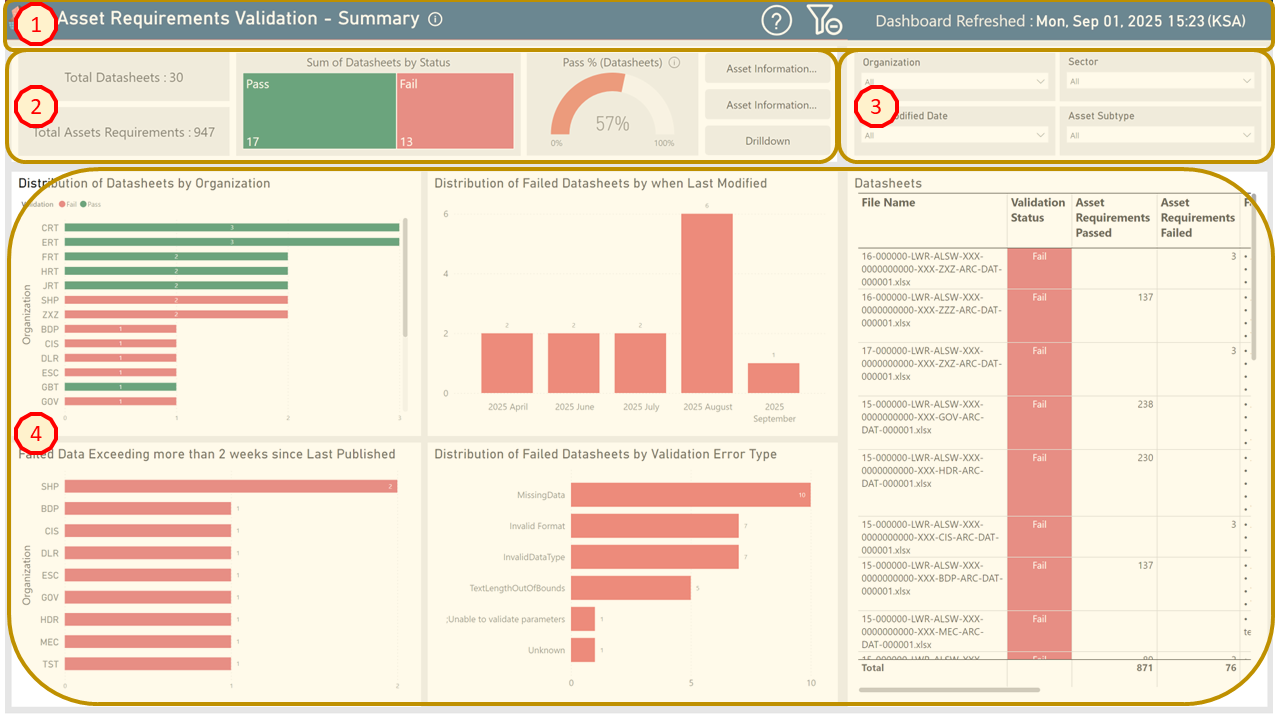
Fig. 1 - Validation Summary Overview
Expand Me to Read What Each One Is!
- Title Bar — This bar contains the Dashboard Title, Feedback & Clear Filters Toggle, and the Timestamp of the last refresh.
- High-Level Metrics — These consist of Datasheet Counts, the Ratio of Passed and failed Datasheets, the Percentage Passed, and Links to other Dashboards.
- Slicers — Consisting of Filter Options for users to utilize for specific areas of interest.
- Charts / Visuals — Consisting of Graphs, Charts, and Tables to disseminate Validation Content.
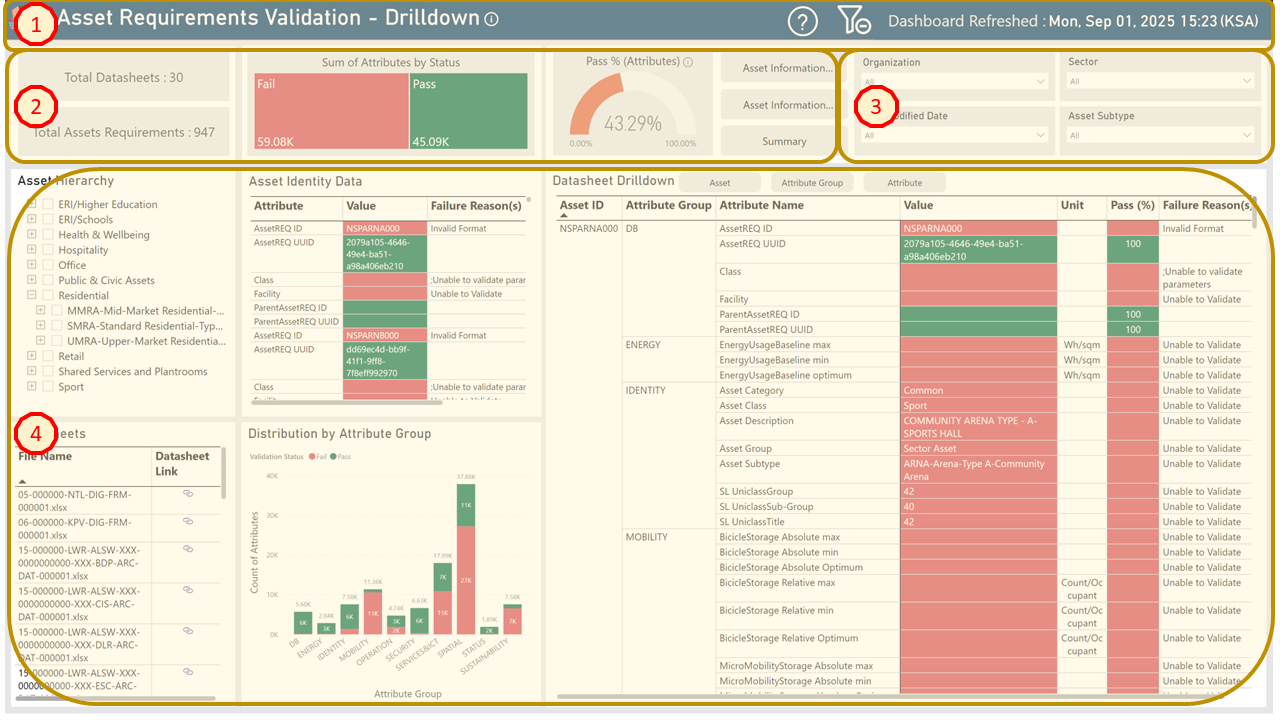
Fig. 2 - Validation Drill-Down Overview
Expand Me to Read What Each One Is!
- Title Bar — This bar contains the Dashboard Title, Feedback & Clear Filters Toggle, and the Timestamp of the last refresh.
- High-Level Metrics — These consist of Datasheet Counts, the Ratio of Passed and failed Attributes, the Percentage Passed, and Links to other Dashboards.
- Slicers — Consisting of Filter Options for users to utilize for specific areas of interest.
- Charts / Visuals — Consisting of Graphs, Charts, and Tables to disseminate Validation Content.
Title Bar
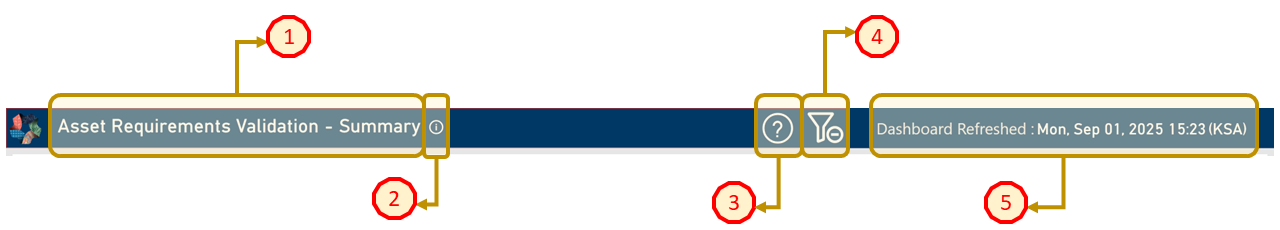
Fig. 3 - Title Bar Breakdown
- Dashboard Title Name
- Displays the title of the dashboard.
- If ever in doubt of what the dashboard is presenting to you, go to Item 2 in this list.
- Link to Guidance
- Selecting this will direct you to the specific help page in this documentation (as a new window).
- Link to Feedback Form
- Selecting this will direct you to the Feedback Form, where you can raise bugs or provide feedback such as feature suggestions, improvements etc. For more information, click here for guidance on the feedback form.
- Clear all Filters & Selections
- Clicking this will reset the whole dashboard from all filters.
- Last Dashboard Refresh
- Displays the date and timestamp of when the dashboard was last refreshed with the latest analysis.
High-Level Metrics
Fig. 4 - Title Bar Breakdown
- Total Number of Datasheets
- Displays total number of datasheets validated and is present on dashboard for the user to review.
- Total Number of Requirements or Assets/Spaces
- For Asset or Space Requirements Dashboards - Displays Total Number of Asset or Space Requirements validated and is present on dashboard for the user to review.
- For Asset or Space Information Dashboards - Displays Total Number of Assets or Spaces validated and present on the dashboard for the user to review.
- Sum of Datasheets or Attributes by Status
- For Asset or Space Summary Dashboards - Graphical indicator presenting the ratio of datasheets that have either passed (GREEN) or failed (RED).
- For Asset or Space Drill-Down Dashboards - Graphical indicator presenting the ratio of attributes that have either passed (GREEN) or failed (RED).
- Users can select each indicator (Pass or Fail), and the Charts / Visuals update based on the selection.
- Validation Pass Rate (%) at Datasheet or Attribute Levels
- For Asset or Space Summary Dashboards - Graphical indicator of percentage of passed datasheets.
- For Asset or Space Drill-Down Dashboards - Graphical indicator of percentage of passed attributes.
- Users can select each indicator (Pass or Fail), and the Charts / Visuals update based on the selection.
- Links to other AII dashboards
- This Shortcut Links section allows users to navigate to other dashboards by clicking the link.
- The first two buttons are links to other AII dashboards. Please note, these links vary between each dashboard.
- The last button allows you to go to the drill-down page or summary page for the specific dashboard you are on. (e.g., Asset Requirement Validation, Space Information Compliance, etc.)
Slicers / Filters
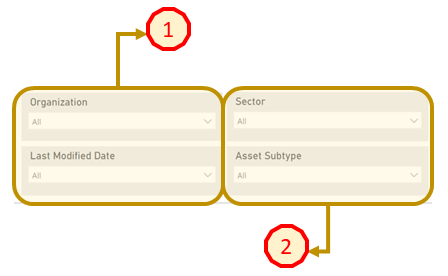
Fig. 5 - Slicers / Filters Panel
- Organization & Last Modified Date
- All AII Dashboards - Allows users to filter by either specific design consultant (Organization) and/or by known submission date (Last Modified Date). - Please note - That all filter can be both selected to filter even more selectively.
- Sum of Datasheets or Attributes by Status
- For Asset Requirements & Information Dashboards only - Allows users to filter by either NEOM Sectors and/or by Asset Subtype.
- Please note - That all filter can be both selected to filter even more selectively.
Charts / Visuals - Summary
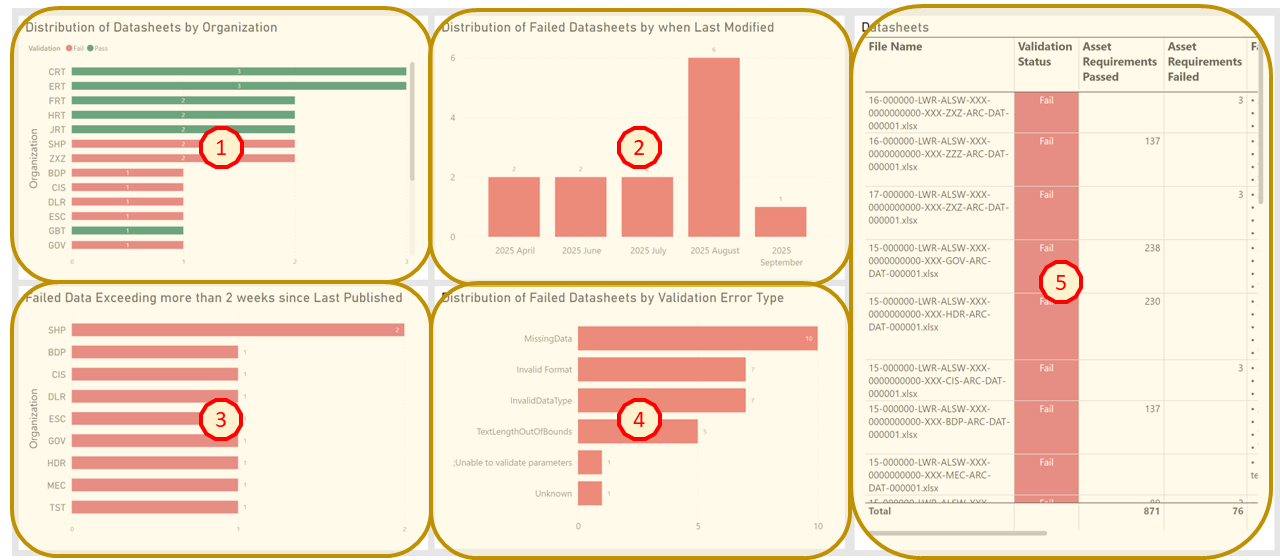
Fig. 6 - Charts / Visuals - Summary Dashboard
- Distribution of Datasheets by Organizations
- Graphical representation of all total Pass or Failed datasheets across different organizations.
- Distribution of Failed Datasheets by When Last Modified
- Graphical representation of the breakdown of total failed datasheets across various months.
- Failed Datasheets Exceeding More Than 2 Weeks Since Last Modified
- Graphical representation of datasheets that have failed but have not been updated/modified by the organization in the last 2 weeks.
- Distribution of Failed Datasheets by Validation Error Type
- Graphical representation of the total number of validation errors and their types taken from all the datasheets.
- Datasheets
- Table outlines each datasheet represented by each row and key Information: Validation Status: Assets Passed; Assets Failed; Reason (if Asset Failed); Link to the datasheet; Last Modified Date.
Drilldown
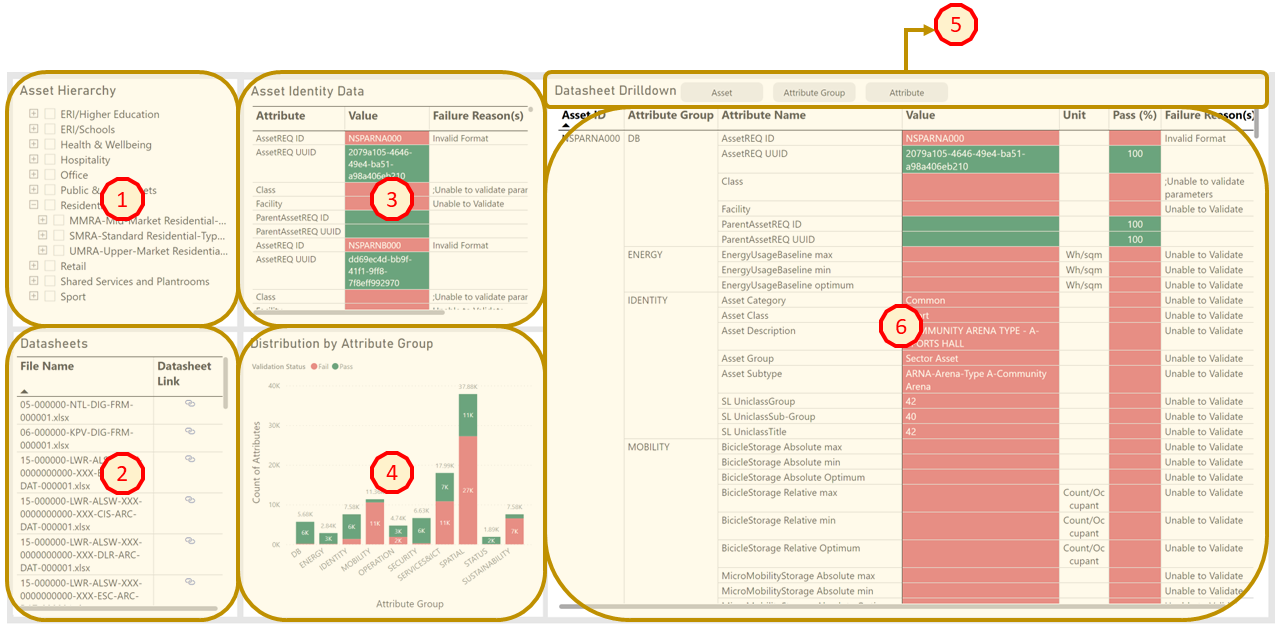
Fig. 7 - Charts / Visuals - Drilldown Dashboard
- Asset Hierarchy
- Filter on one or multiple assets. Filters can be applied to Class/ subtypes by expanding the asset hierarchy and selecting individual subtypes. The dashboard updates according to the selection.
- Datasheets
- Filter one or multiple datasheets (hold down CTRL key to select multiple). The dashboard updates according to the selection.
- Asset Identity Data
- Presents a table listing each attribute for an asset or asset subtype and whether its value has passed (green) or failed (red). If failed, a reason is provided in the Reason column.
- Distribution by Attribute Group
- Graphical representation of the total number of attributes across different attribute groups and whether they have passed (green) or failed validation/compliance checks. The Attribute Groups can be selected filter the data to represent only the specific attribute group
- Drilldown and Roll-up Functionality:
- The table can be drilled down and rolled up to provide the Pass% at different levels:
- Asset Level: Pass% to help users identify which assets need attention. Focus only on Pass%.
- Attribute Group Level: Shows Pass% for each attribute group. Focus only on Pass%.
- Attribute Level: Displays detailed values and reasons for failures. Use the button to roll up or down between levels.
- The table can be drilled down and rolled up to provide the Pass% at different levels:
- Datasheet Drilldown
- Provides detailed Information on assets and their associated attributes. The table includes:
- Asset ID
- Model Name
- Model Link – Navigates to the ACC in the Model Viewer
- Attribute Group
- Attribute Name
- Value - Indicates whether it has passed (green) or failed (red).
- Unit - The unit the attribute is measured in.
- Pass (%) - Pass percentage (100% indicated in green).
- Reason - If failed (red), provides a reason why.
- Provides detailed Information on assets and their associated attributes. The table includes: